FYI from BSF, 5.3.24
Perhaps no student outcome has improved more during the past two decades than high school graduation rates. That is true nationally, that is true in Massachusetts, and that is true in Boston.

Data released last week does reveal a small decrease from last year (-0.5%), only the third decline since this data began being publicly reported nearly twenty years ago.
Over time, not only have Boston’s high school graduation rates increased, but the gaps between subgroups have narrowed, with many historically marginalized groups improving their performance relative to their peers.

That said, there are still significant variations that lie below the surface of the average.
Despite progress, the gaps between subgroups are still significant. The majority of subgroups still fall below the district rate. The annual lower graduation rates for students with special needs and English learners remain a consistent issue.

There are also significant variations by school. At first blush, the distribution looks pretty even, with roughly the same number of schools above and below the district average.

As percentages, though, the graph above doesn’t tell the whole story. The 28 schools listed above range in enrollment size from 2,401 to 41. When you account for graduation by the actual number of students earning a diploma, the picture looks very different.
Just four schools - the three exam schools and East Boston High School - account for nearly half (44%) of the entire Class of 2023. Remove them, and the district’s graduation rate drops nearly 10 points (71.7%).

Skews like this simply don’t exist in other Massachusetts communities. Worcester and Springfield each only have six high schools, for about half the number of students in Boston. Lynn’s enrollment is about one-third of Boston’s; Lynn offers three high school options.
With a master facilities process produced and potentially new projects to be announced this month, a central trade-off has been posed: the number of school options versus the enrollment and resources available at each school.
Will solving this also address the variation we still see in high school graduation rates?
notes in the margin
Codman Academy is the second Boston charter school to unionize this year.
Less policy, more true crime: a profile of the 32-year old woman who posed as a Boston high school student.
The Board of Elementary and Secondary Education met Tuesday (materials here).
The Massachusetts House passed their version of the FY25 budget, while cities and towns contend with cutting theirs. To address budget shortfalls, Newton is considering enrolling students from other communities.
The Massachusetts legislature rejected the prospective ballot question to end the MCAS high school graduation requirement. Next step, signatures.
The “Matthew effect,” but for online math platforms.
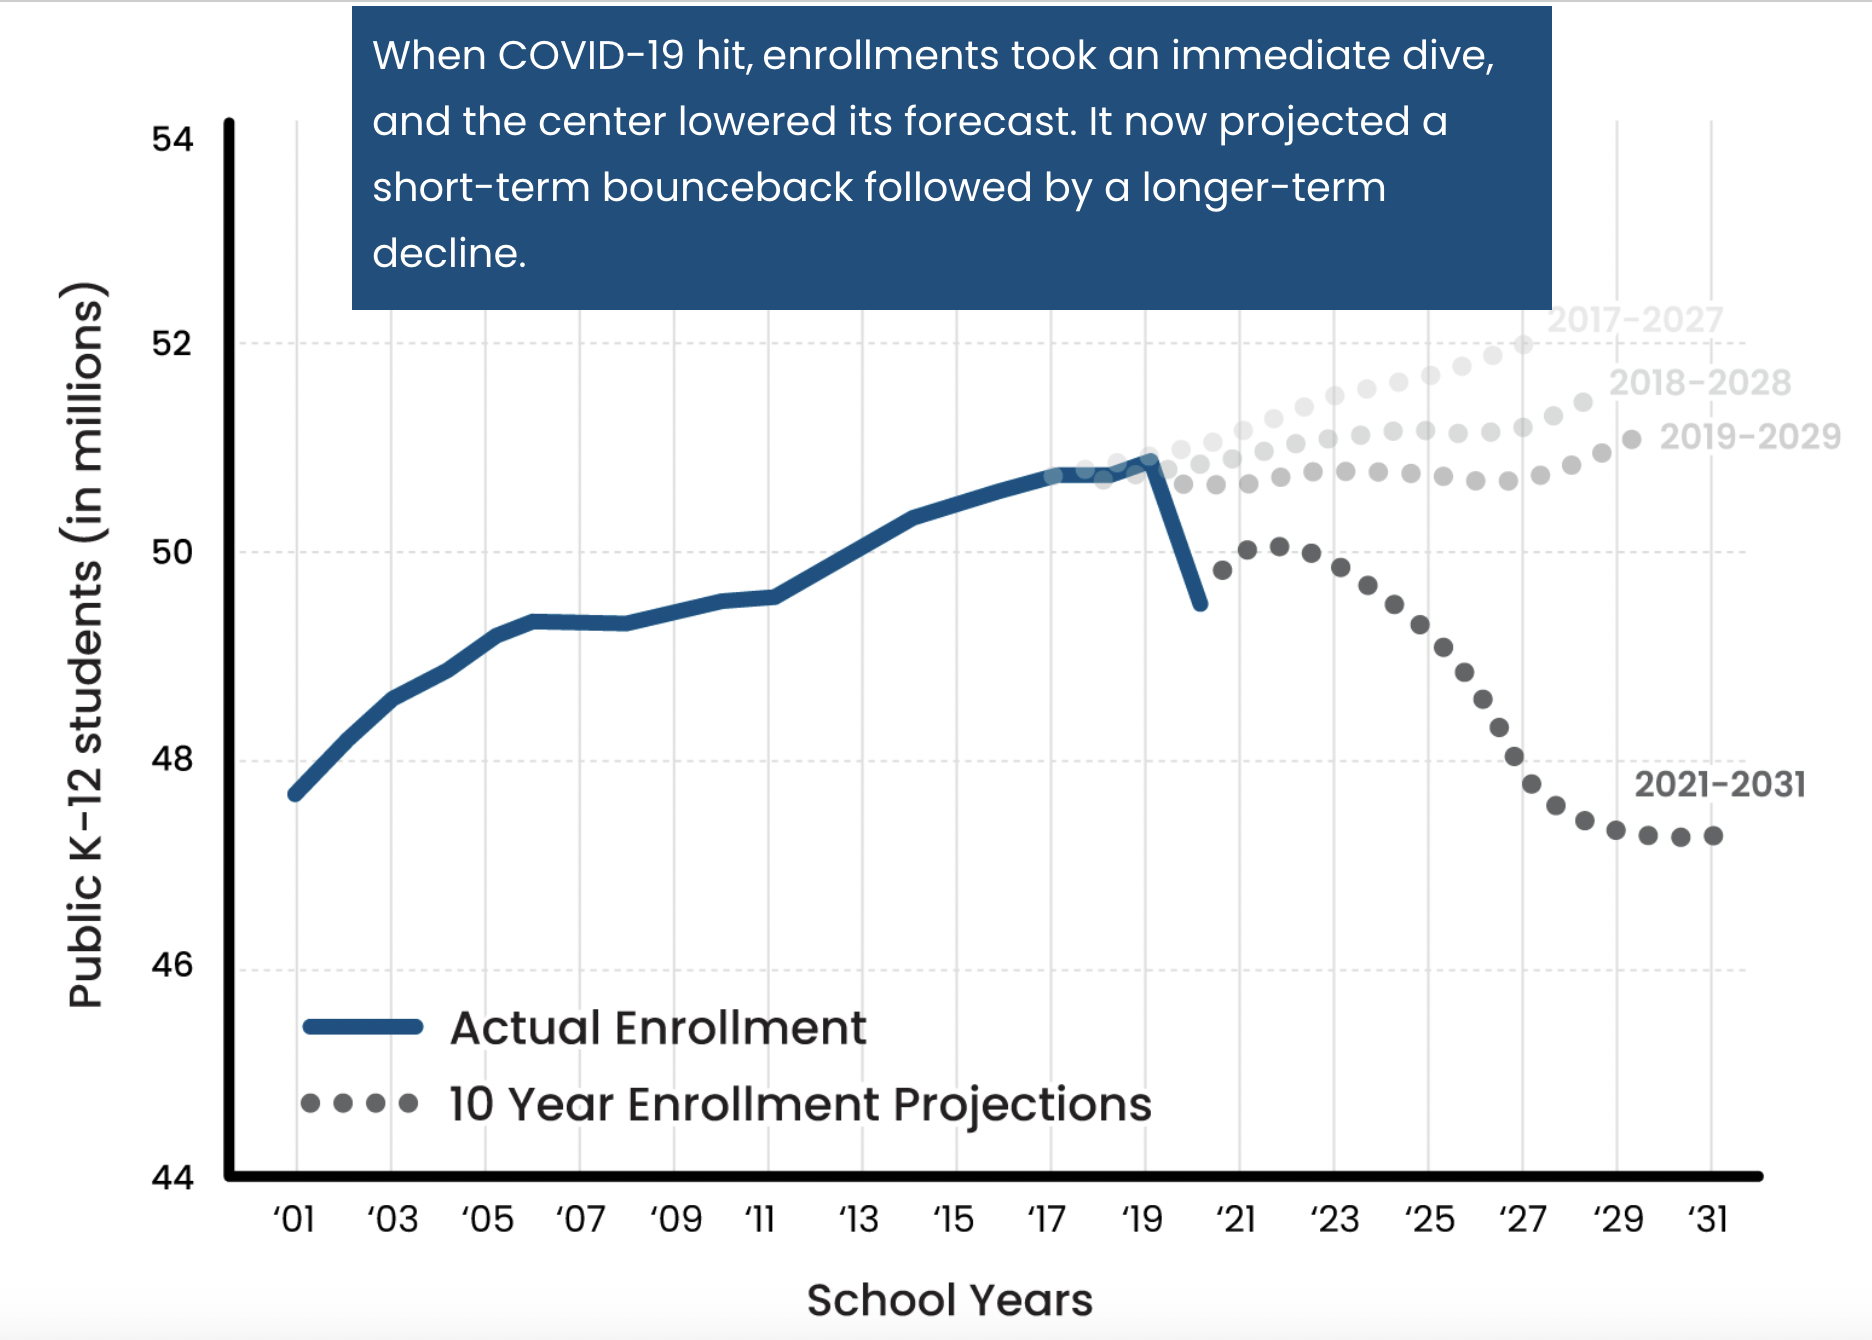
Lower enrollment in schools is not a blip, but a new normal according to updated projections from the National Center for Educational Statistics (“center”).
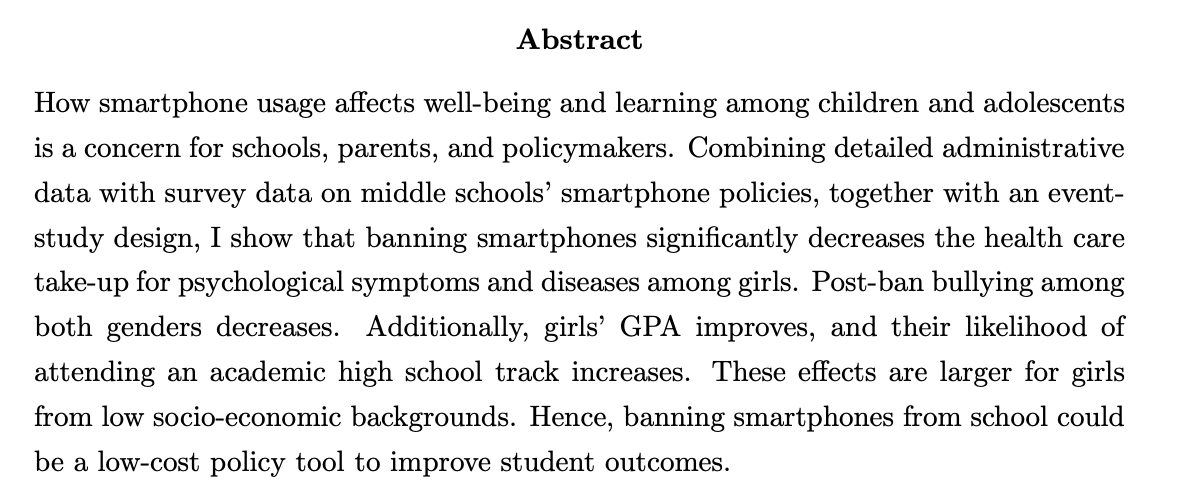
Here is what happened in Connecticut when one school banned student use of cell phones. Here is what happened in the country of Norway banned cell phones in middle schools:
The national politicization of college campus protests continues to find local angles. Boston Mayor Wu was disinvited from an event at Harvard because Boston Police broke up an encampment at Emerson, and a former Boston School Committee member’s comments made national headlines.
How much of this is just a function of polarization and media attention? As pointed out here, only 5 of the ~64 Greater Boston colleges and universities are experiencing unrest. Most of local higher education has other things to worry about, too.
Hearing stories and seeing data that makes you think that college admissions may be out of whack? You are not alone.